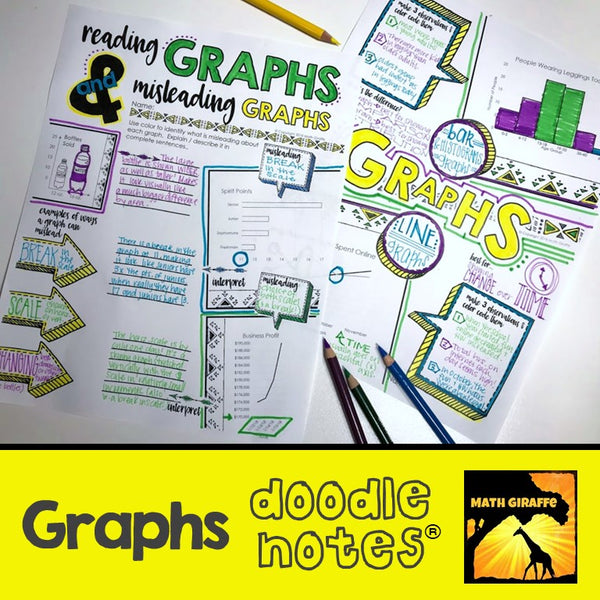
Graphs Doodle Notes
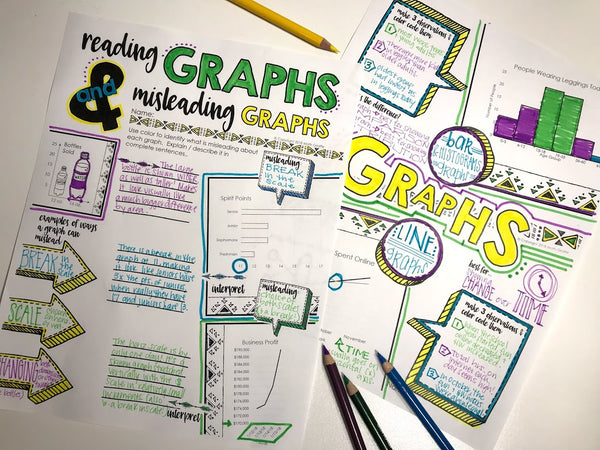
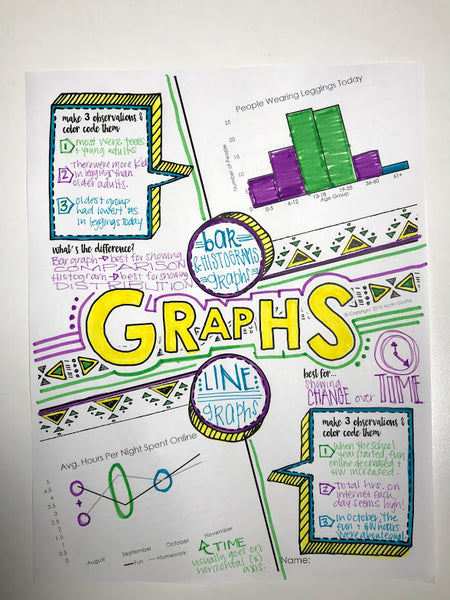
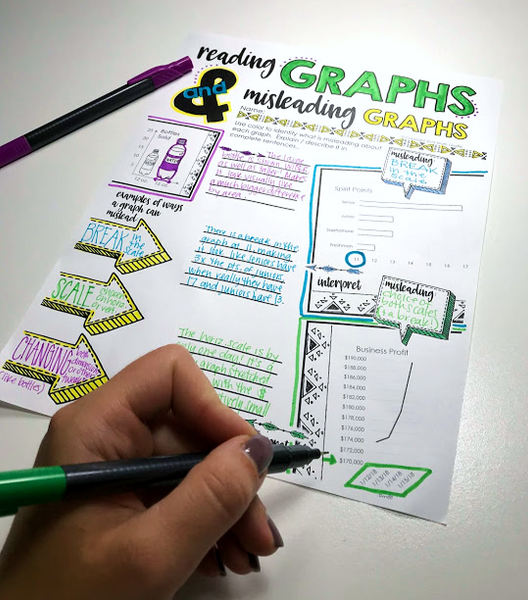
Interpreting and reading bar and line graphs, understanding misleading graphs and stats: 2 page visual interactive "doodle notes" set -
When students color or doodle in math class, it activates both hemispheres of the brain at the same time. There are proven benefits of this cross-lateral brain activity:
- new learning
- relaxation (less math anxiety)
- visual connections
- better memory & retention of the content!
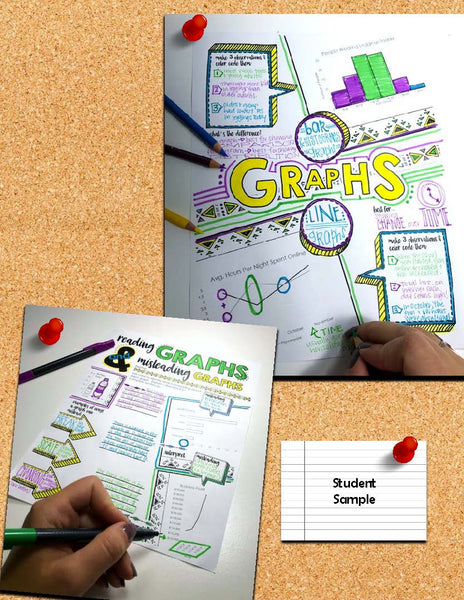
Students fill in the sheets, answer the questions, and color, doodle or embellish. Then, they can use it as a study guide later on. Graphic doodle and sketch notes take full advantage of Dual Coding Theory (the way brains process visual and linguistic information) to maximize retention.
Content includes:
- bar graph vs. line graph - what each is best for showing
- reading and understanding bar graphs / histograms / line graphs
- interactive color-coding tasks
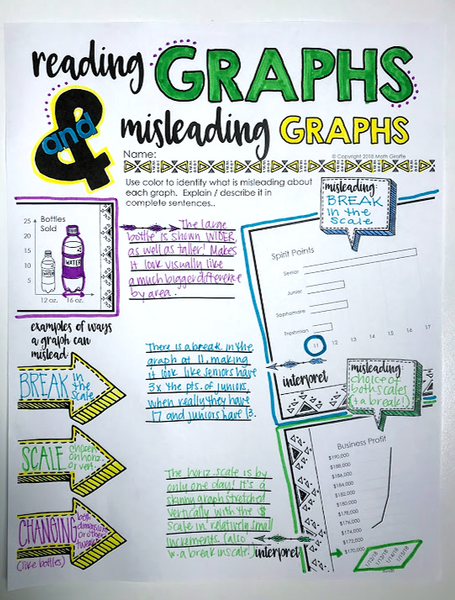
- breaks in the scale
- misleading graphs through choice of axis, etc.
- choice of scale and dimensions
- practice & examples
Check out the preview images for more detail about this item and the research behind it.
Visual note taking strategies like sketch notes or doodle notes are based on dual coding theory. When we can blend the text input with graphic/visual input, the student brain processes the information differently and can more easily convert the new learning into long-term memory.
This strategy also integrates the left and right hemispheres of the brain to increase focus, learning, and retention!
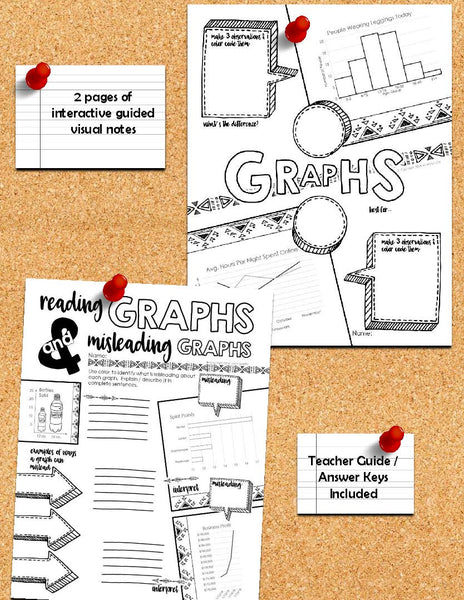
2 pages are included, plus answer keys, samples, and info.
_________________________________________________________________________
Reviews from other teachers:
-I like this resource, and it was helpful for the students to practice drawing their own graphs with the scaffolded notes. Thank you!
-My textbook did not have a lot of resources on misleading graphs. This was a great resource to supplement the textbook and give the students more examples.
-I used this in a science classroom to talk about different ways we use graphs to display our scientific data. Students enjoyed the visual.
-I used this resource as direct instruction to review graphing and data analysis with my 7th grade science students. Students enjoy shorter versions of notes and were very engaged in this lesson as it incorporated some creativity.
-Engaging and very helpful! The students are interested in filling it out and referring back to it!


