Measures of Central Tendency Doodle Notes (Mean, Median, Mode, & Range)
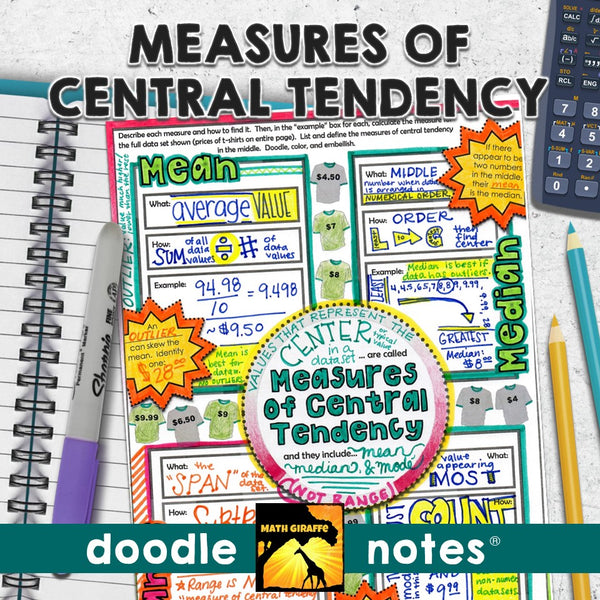
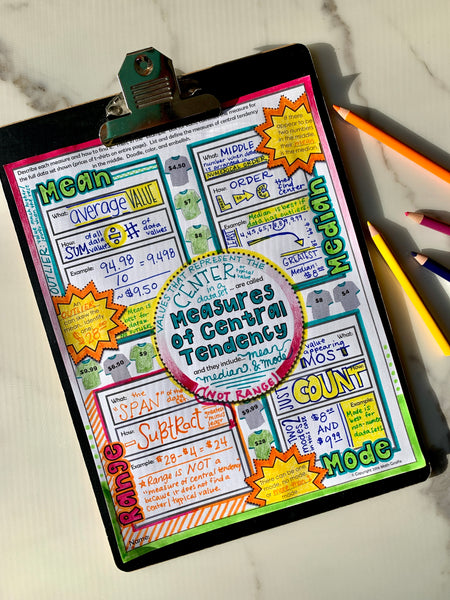
Mean, Median, Mode, and Range (Measures of Central Tendency): "doodle notes" - visual note taking pages with interactive tasks for building stronger retention of measures of center (mean, median, mode, and range) for your middle school statistics unit in Pre-Algebra
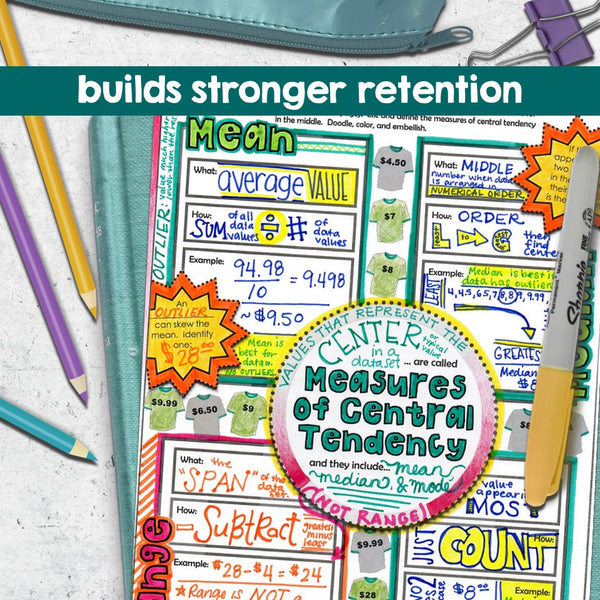
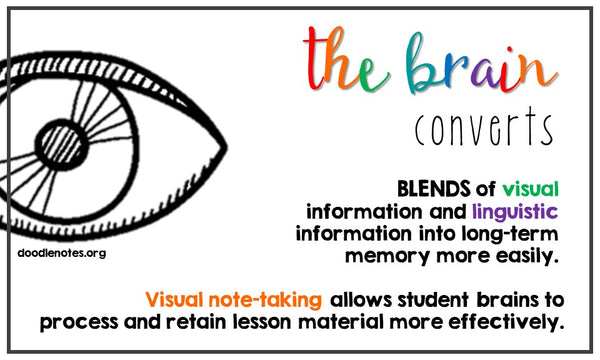
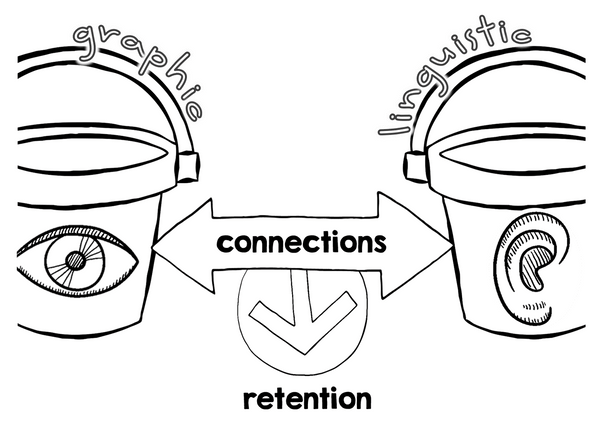
Boost your students' focus and memory! The blend of graphic and linguistic input in these guided visual notes helps students' brains to convert the information to long-term memory more easily.
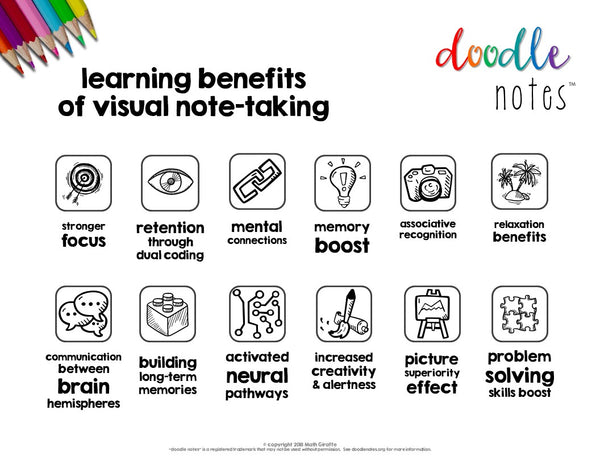
When students color or doodle in math class, it activates both hemispheres of the brain at the same time. There are proven benefits of this cross-lateral brain activity:
- new learning
- relaxation (less math anxiety)
- visual connections
- better memory & retention of the content!
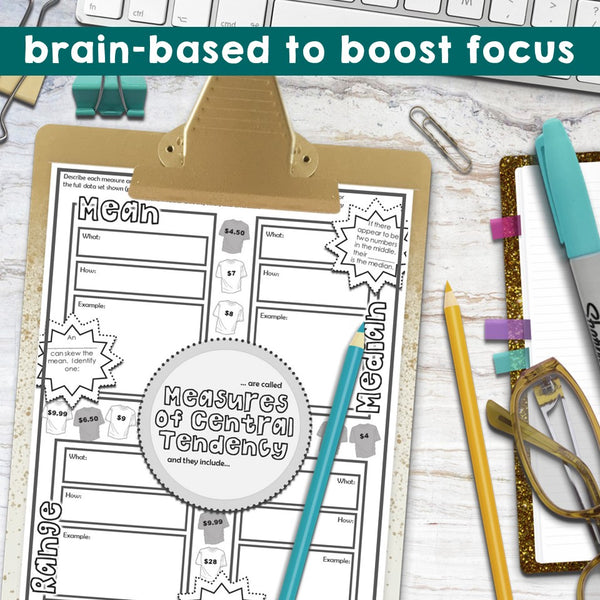
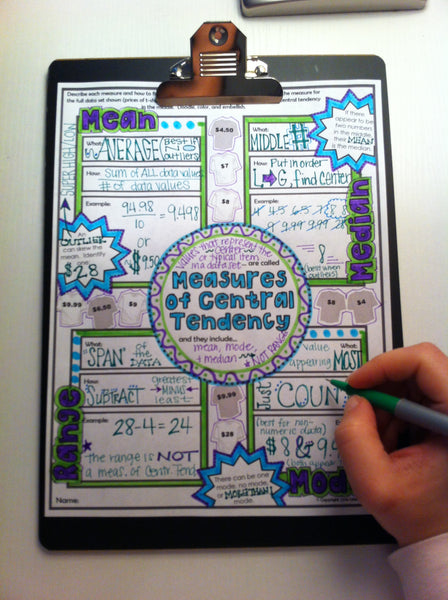
Students fill in the sheets, answer the questions, and color, doodle or embellish. Then, they can use it as a study guide later on.
Content includes:
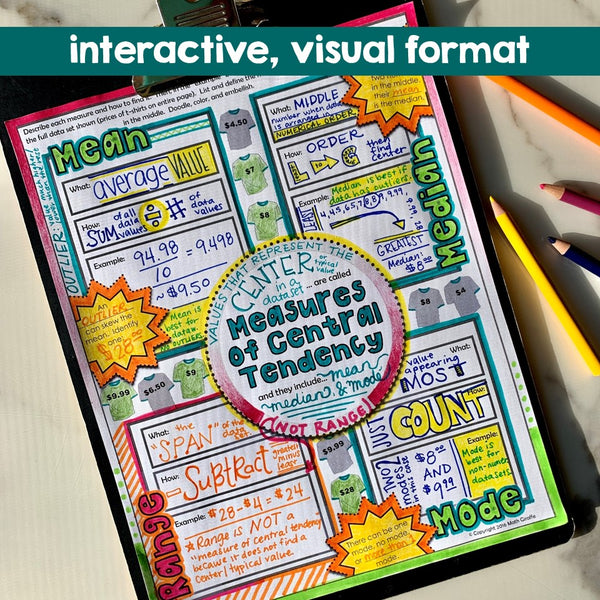
- What are measures of central tendency?
- How to find mean, median, mode, and range
- Special cases - more than one mode, averaging two middle numbers to find a median, etc.
- When each measure is best (outliers, etc.)
- Example for each
Check out the preview images for more detail about this item and the research behind it.
Visual note taking strategies like sketch notes or doodle notes are based on dual coding theory. When we can blend the text input with graphic/visual input, the student brain processes the information differently and can more easily convert the new learning into long-term memory.
This strategy also integrates the left and right hemispheres of the brain to increase focus, learning, and retention!
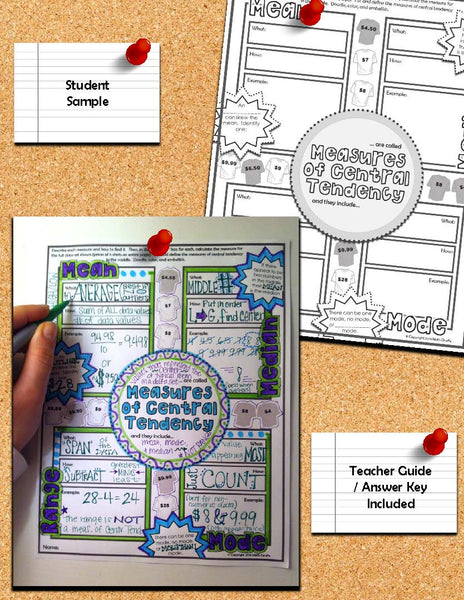
1 page is included, plus an answer key, sample, and info.
___________________________________________________________________
Reviews from other teachers:
-My students really enjoyed this doodle note in class. We went through it together as a whole class. Both my higher learners and low learners could follow along. This product was very engaging.
-I used this resource with my Algebra Part A students. They were engaged and enjoyed doodling while I was teaching the lesson. I would recommend this resource for a class that needs a little something extra in order to keep the class learning the lesson being taught.
-I teach Mean, Median, Mode, and Range to my 5th graders after testing to help prepare them for 6th grade. They love doodle notes and had a great time with this one.
-I love doodle notes and so do my students. This is the only review that I use with my high school students to review mean, median, and mode.
-Engaging and helpful during distance learning for my son. He enjoyed the graphics and it helped to keep him engaged while learning and reviewing.
-I used this resource as a review of Mean, Median, Mode, and Range, before getting into our statistics unit. I loved the simplicity of this resource and the connection to selling t-shirts.


